Authored by Sheraz Mian of Zacks Investment Research (originally posted at The Burning Platform blog),
We all know that markets don’t always reflect the health of the economy. It is not unusual to experience stellar market returns in an otherwise mediocre economic backdrop – something that investors are currently experiencing. But future success in this investing climate is a greater challenge and requires a good hard look at how realistic earnings expectations are.
On March 28, the S&P 500 hit a new all-time closing high and is now on the cusp of surpassing the intraday high set in March 2000. The Dow Jones Industrial Average and a number of market indices comprising small- and mid-cap stocks are already at record levels – all in the midst of a struggling economy.
The first-quarter 2013 reporting season about to get into high gear will be the second earnings cycle of the current market rally. The rally got underway last November, but the first two months this year overlapped with the fourth-quarter 2012 earnings season. With corporate earnings generally considered to be the mother’s milk of stock prices, the market’s positive year-to-date momentum could be safely interpreted as investor satisfaction, if not happiness, with the earnings picture.
Past performance matters to the market, but it is far more concerned with what will happen in the future. After all, stock prices reflect expectations about the future. You can think of these future expectations built into the current stock prices as the collective wisdom of all investors. “Consensus” estimates of all the key variables that investors care about – like earnings, revenues, the economy, the Fed, etc. – reflect this “collective wisdom.”
So, where do current market expectations stand?
Earnings growth has been essentially flat over the last three quarters, a trend that current consensus expectations project into the first half of 2013. But the market’s “collective wisdom,” as reflected by consensus estimates, expects growth to come roaring back in the second half of the year and continue into 2014.
My experience leads me to disagree with the consensus. I don’t see a return to booming growth panning out this way, and would like to share the basis of my skepticism with you.
I am by no means suggesting that an earnings train wreck is on the horizon. Nor am I making a call to exit the market altogether. What I am suggesting instead is that current earnings expectations are vulnerable to significant downward revisions. An acceleration in that negative revisions process will most likely result in the market giving back some, if not all, of its recent gains.
You don’t have to agree with my conclusions, wholly or partly. In fact, many of my colleagues and I don’t see eye to eye on this issue. But nevertheless, it would pay to be a little skeptical of current earnings expectations being touted in the media, and maybe take another look at your portfolio to perhaps reposition it for a period of potential market weakness.
The discussion is particularly timely with the 2013 Q1 earnings season about to get underway. Expectations remain low, as they were ahead of the 2012 Q4 earnings season. The Q4 earnings season turned out to be better relative to preseason expectations, and we will likely see a repeat performance in the Q1 earnings season. But that shouldn’t lead to overly optimistic expectations for the coming quarters.
My goal in this write-up is to give you an update on how the Q4 earnings season turned out, and what recent estimate revisions trends tell us about the future of earnings growth.
Evaluating the Q4 Earnings Season
By most conventional measures, the Q4 earnings season turned out to be average. Not particularly good, but not bad either.
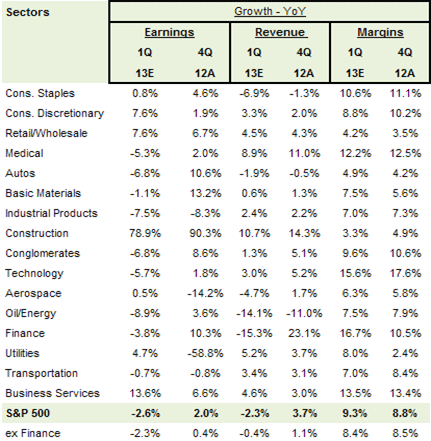
Total earnings for companies in the S&P 500 were up +2% year over, and 65.6% of companies beat earnings expectations with a median surprise of +3%. Total revenues were up +2.6%, with 62% of companies beating top-line expectations and median revenue surprising by +0.6%. Excluding the Finance sector, earnings were barely in the positive category.
The table below provides a summary picture of the actual results for 2012 Q4 and consensus expectations for 2013 Q1. Please be mindful of two factors as you read the table below and other earnings data here.
First, we have divided the S&P 500 into 16 sectors, compared to the Standard & Poor’s official 10 sectors. This gives us a more granular view of sectors like retail, construction, autos, transportation, aerospace, and business services. Second, the earnings data here accounts for employee stock options as a legitimate expense, rather than excluding them, as is the practice on Wall Street. As a result, the earnings numbers and growth rates are relatively lower.

Source: Zacks Data. Finance-sector revenue in the fourth quarter got a one-off boost from gains at Prudential Financial (Ticker: PRU). Excluding the Prudential revenue, total Finance-sector and S&P 500 revenue growth would be +11.9% and +2.6%, respectively. The margins column represents the net margins (total net income/total sales).
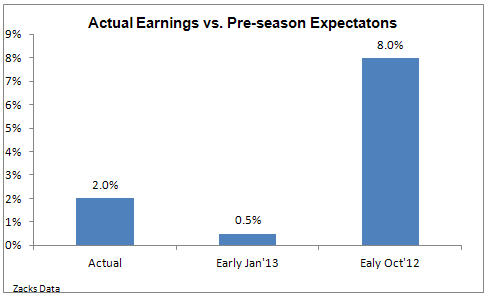
Despite Q4?s average results, the stock market’s strong year-to-date performance shows that investors are overall quite happy with them. But why would this be? Simply, the reason is the extremely low levels to which expectations had fallen as the reporting season was getting underway in early January.

As you can see in the chart above, consensus expectations in early January were significantly below where they stood in early October. This tells us that the market’s favorable response to the Q4 earnings performance was largely a function of how low expectations had fallen between October and January.
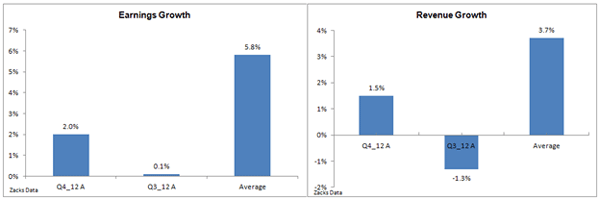
But how does the Q4 earnings performance compare to other quarters?
- The growth rates for earnings and revenues were better than in Q3, but significantly lower compared to the average for the preceding four quarters.

Note: The average is of the four quarters preceding 2012 Q4.
- The “beat ratio,” the percentage of total companies coming out with positive surprises, reflects the same trend, particularly on the earnings side. There is an unusually high proportion of beats on the revenue side, but that’s likely a “payback” for the very low beat ratio in the third quarter. Expectations had come down to an exaggeratedly low level following the Q3 underperformance, which set us up for the unusually high level of positive revenue surprises.

Evaluating Expectations for the Coming Quarters
Earnings estimates from analysts are heavily influenced by guidance from management teams, particularly on the earnings calls. And while the tone of guidance in Q4 was somewhat less negative relative to what we heard from management teams in Q3, it was nevertheless predominantly weak and tentative. This prompted analysts to cut their estimates for the coming quarters, and particularly Q1.
The first table below provides the expected earnings growth rates for the coming quarters, while the second table looks at this year and next.

Note: The growth rates are year over year
To provide a context for the consensus growth expectations for the coming quarters, the next two tables show the absolute dollar levels of total quarterly and annual earnings (as against the YoY growth rates shown above).

Note: The quarterly data is for actual total earnings in the last four quarters and the consensus earnings expectations for the coming four quarters. The annual data shows the actual earnings for the five years through 2012 and the next two years. For example, companies in the S&P 500 earned $238.2 billion in the last quarter of 2012 and $965 billion for the full year 2012. Consensus expectations are for total earnings to come in at $242.3 billion in 2013 Q1 and $1.03 trillion in full-year 2013.
What we see from looking at the last few quarters is that total quarterly earnings have yet to get back to the 2012 Q1 peak of $248 billion. Total earnings have basically been trending down over the last three quarters, but consensus expectations are looking for earnings to start trending back up from 2013 Q1 onwards, with the growth pace materially picking up from Q2 onwards.
Another way to look at this data is by comparing the consensus expectations for the first half of 2013 with the actual results for the same period in 2012. Expectations are for flat earnings growth in the first half of the year, but a ramp-up in the back half of the year to a growth pace of +9.5%. This growth momentum is expected to carry into 2014, giving us earnings growth of +11.7% that year, after the +6.8% gain in 2013 and the +3.8% growth in 2012.
In absolute dollar terms, consensus expectations are for companies in the S&P 500 to earn $1.03 trillion (yes that is a trillion) in 2013 and $1.15 trillion in 2014. In terms of earnings per share, this approximates to $109.88 per “share” of the S&P 500 index in 2013 and $122.72 in 2014.
How Realistic Are These Expectations?
In my professional opinion, they are not realistic. I don’t think these expectations will pan out, and here is why.
Earnings increase through two ways: revenue growth and/or margin expansion (margins are basically earnings as a percentage of sales). The outlook on both fronts is problematic.
Margins have peaked already and at best can be expected to stabilize around current levels. And you can’t have significant revenue growth in the current growth-constrained environment.
Another avenue for growth, particularly at the individual company level, is through mergers and acquisitions. While many M&A deals don’t end up creating value for the acquiring company’s shareholders and don’t generate growth at the aggregate level, they do produce growth at the company level. The historical track record of corporate deal making, in terms of aggregate growth and returns, is spotty at best. But management teams are ever ready for a deal, particularly when elevated equity markets provide them with an easy-to-use currency and the credit markets are willing to fund anything, as is the case at present.
The expected strong earnings growth in the second half of 2013 and next year reflect a combination of revenue growth and margin gains. Revenue growth has a very strong correlation with (nominal or non-inflation-adjusted) global GDP growth. But economic growth has been very anemic lately, with the rich world’s slow-motion deleveraging process casting a dark shadow over the faster-growing emerging world.
The US economy is actually in better shape relative to the recession in Europe and Japan’s nascent efforts to inflate away its problems. But that’s only in relative terms– the reality is that the US economy is at best on a sub-2% growth trajectory. Even that growth pace may be at risk from unfolding fiscal austerity efforts such as the budget sequester and Fiscal Cliff-related tax hikes.
But consensus expectations are looking for a second-half 2013 GDP growth ramp-up that pushes the growth pace close to +3%, and even higher next year. With the US economy barely producing any growth in 2012 Q4, it is hard to envision the growth outlook improving to that extent. But current revenue-growth expectations reflect these optimistic assumptions.
As the chart below shows, margin gains play a big part in projected earnings growth in the coming quarters.
©
Note: These are net income margins, meaning total net income for the S&P 500 as a percentage of total sales. The data for the last four quarters and last seven years represents what companies actually reported. Net margins for the next four quarters and two years represent current consensus expectations.
Margins have already travelled quite some distance from the 2009 bottom and are essentially in line with the prior cyclical peak. One could argue that margins should move past the prior peak like the stock market; but before we buy into that argument, let’s not forget what gave us the 2006/2007 peak in the first place. Without even getting into the details of how the housing bubble back then pumped up everything, one could say with a lot of confidence that those were unusual times and cannot be expected to repeat. Total earnings, on the other hand, are already above the 2007 peak.
Margins follow a cyclical pattern. They expand as the economy comes out of a recession and companies use existing resources in labor and capital to drive business. But eventually capacity constraints kick in, forcing companies to spend more for incremental business. At that stage, margins start to contract again. Given the extent of unemployment and under-employment in the US economy, one could reasonably say that we haven’t reached those levels. That said, it is hard to envisage companies doing more with less forever.
So What Gives?
Not only are margins already at record levels, but corporate earnings as a share of GDP are also at multi-decade highs. Just as trees don’t grow to the skies, margins and the ratio of earnings to GDP don’t expand forever, either.
What all of this boils down to is that current earnings estimates are too high and they need to come down – and come down quite a bit. One could reasonably draw a scenario where earnings growth turns negative this year. But the most likely path appears to be for earnings growth to flatten out – with the absolute level earnings this year and next not much different from what we got in 2012.
Granted, negative earnings revisions would not be a new phenomenon, as estimates have been coming down for more than a year now. But the market has essentially shrugged off this weakening picture in the hope of an improving earnings outlook for the coming quarters. Importantly, investors have been heartened by the improving outlook for China, a less worrisome European picture, and resolution of some of the domestic macro issues.
But the level of calm in the market is bordering on complacence. After all, Europe remains in a recession; and recent Chinese data about PMI, industrial production, retail sales, and inflation show that we can’t take a rebound in that country for granted. Importantly, recent talk of changes to the Fed’s QE program from within the FOMC are offsetting its effectiveness, Bernanke’s assurances notwithstanding.
With global tailwinds dissipating, the earnings outlook question becomes far more significant for the market. Unless the domestic and international growth backdrop materially improves from current levels, it is hard to imagine current earnings growth expectations holding up. And as investors wake up to the significantly weaker corporate earnings backdrop over the coming months, it will become harder to justify the market’s recent gains, potentially leading to a broad-based pullback.
Investing in a Low Earnings Growth Environment
The bottom line is that actual earnings growth will be substantially lower than what is currently built into stock prices. This view is contrary to current consensus expectations and could potentially serve as a major headwind for the market once investors begin to share it in coming months.
The way to invest in such an environment is to look for stocks that don’t reflect aggressive growth expectations and that enjoy company-specific growth drivers not tied to broader macro trends. Companies that generate plenty of cash flows beyond their immediate capital needs and have track records of sharing excess cash with shareholders through dividends and buybacks are particularly well suited for a period of sub-par earnings growth.


