Which Way Wednesday - Cliffmas Is Upon Us
Merry Cliffmas!
That's all the MSM is talking about but the markets are, so far, drifting along in the upper end of the year's range into this potential "fiscal disaster." Perhaps the catastrophe is already priced in or perhaps it simply won't be a big deal to go back to pre-2000 tax rates and to force some spending cuts.

If falling off the cliff is priced in, a "solution" might rally the markets. On the other hand, fixing the Fiscal Cliff may weaken our markets as it puts the US on the continued path to endless debt through printing money.
Of course Japan has continued down the path of endless debt through printing money and its markets have been on fire this week. With the re-election of Helicopter Abe, who has vowed to weaken the yen by printing them by the Trillions, the Nikkei has jumped 2.5% this week - all the way back to 10,330 while the Yen falls to 85.36 to the Dollar - a 3-year low.

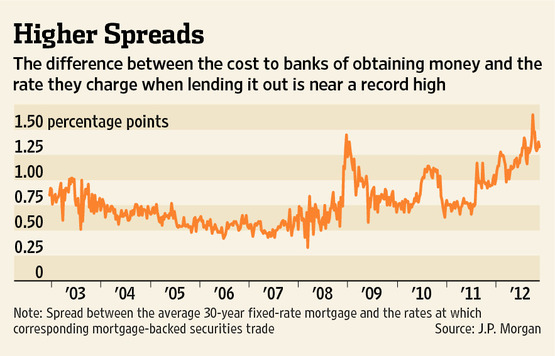
Our own easy-money policy coupled with the refusal of the Banks to pass it along to the consumer has created record-high spreads between what the Banks pay for money and the 30-year fixed rate mortgage they charge consumers. Banks are now making spreads of 1.25-1.5%. This is compared to the less than 0.5% which they managed to get by on in the early years of the 21st Century.
Despite making these usurious rates, they still offer the consumers less than nothing for deposits (as in, not enough to cover even "core" inflation) and they still can't attract investors, with the banking sector still down near half of where it was in 2007, when XLF was in the high $30s.
Another cliff we hit on 12/31 is the end of FDIC's special Transaction Account Guarantee, which provided insurance for accounts over $250,000 and will affect $1.5Tn worth of accounts on deposit at US banks. Banks, especially small ones, are scrambling to avoid losing this money and it will make for an interesting earnings season in Q1 as the banks step into the confessional and indicate how much faith their depositors really have in them.
On the other side of the coin, the Obama Administration is looking to double the size of the popular Mortgage Refinancing Program, which helps modify underwater mortgages, by making it possible for non Government-backed mortgage-lenders to work with the program. As it stands now, about 10% of the 12.1M homes that were underwater (10% of US homes) have been refinanced through the program. This would provide yet another well-timed boost to housing for 2013 as that sector continues to look investable.
With 10M Americans unemployed and under-employed in the Housing Sector alone, this is a great area of the economy for the Obama Administration to be focusing on. As you can see from the chart on the left - housing starts are still nearly half of their historic average after 3 years below the line. Even if you assume we over-built in the earlier part of this decade - we've worked off that excess inventory by now.
From 2001 through 2005 (the last full year that home prices consistently increased), an average of approximately 1.3M households formed in the US, just a little under the 50-year average. In contrast, during the subsequent period of 2006 through 2011, an average of approximately 600K households formed, yet the population grew at largely the same rate.
Weak household formation is most likely related to high unemployment, as people have delayed moving out of their parents’ homes, getting married, or even getting divorced until their employment situations are secure. Even with an unemployment rate that remains stubbornly high, there are recent signs that household formation has begun to normalize. The Census Bureau estimates that in each month of 2012 (through September) there were about 1 million more households on average than in the same month of the previous year. This is a significant change from 2011 when the average year-over-year change was about 635 thousand, and from the previous four years when the average was approximately 550 thousand.
Household formation in 2012 is therefore approaching more normal levels, close to the historical average of about 1.3 million. Over the long-term, household formation is what drives demand for housing and for home construction. The current positive trends in household formation therefore suggest that demand for housing is starting to finally look healthy again. This will be one of the investing trends we are going to follow in 2013. In 2012 - we focused on HOV and it has generated huge returns for our Members as that stock climbed from $1.50 to over $6 (up 300%) in 2012. In 2013, we will broaden our screens to include more potential winners in that sector now that we are more comfortable with the underlying fundamentals.
This is how you invest - you find macro fundamentals that are painting a long-term trend and then you identify medium and short-term opportunities that have that long-term Fundamental support. If you learn to invest like that, you won't need to sweat over every rumor that runs past your screen on a daily basis. These long-term trends are hard to establish and just as hard to break - taking the time to identify them is one of the best investments you can make!
Looking forward to a very profitable 2013 with all of you.
*****
FREE TRIAL TO PHIL'S STOCK WORLD - CLICK HERE & SIGN UP